GuideSIGN Plus 2024 Help
This feature is not available in GuideSIGN SIGMA.
Allows you to place a report for the selected sign panel. This is the second of the two steps in creating a sign drawing, in which data specific to each sign panel is placed. The first step is placing a drawing sheet (see Place Drawing Sheet).
You can also use the Place Report tool to modify your selections after placing a report.
Note: To create a custom report using CAD functionality see Creating Custom Reports in CAD.
The reports supplied with the software are intended as examples only. It is assumed that you will create your own reports either by modifying the ones supplied or by creating new ones from scratch.
Note:
 custom graphic in the list.
Specify the scale at which the sign drawing will be plotted. For imperial scales, you must convert the scale to a ratio (e.g. a scale of 1/4" = 1'-0" converts to a ratio of 1:48, or a Plot scale value of 48).
Specify the text height of the $origin tag of the selected report. This value, together with the Plot scale one, will ensure that the report is scaled to the correct size. Please note the units currently used in the software and indicated to the right of the Report text height box. If these units do not match the units of the original drawing, you must convert the original $origin tag text height value before specifying it in the Report sheet text height box (e.g. if the original $origin tag text height was 2 mm, whereas the software currently uses the imperial system, the converted value specified in the Report text height box will be 0.0787 in).
Note: The example reports supplied with the software were drawn with $origin tag text heights of 2 mm or 0.0787 in.
The letter report type option only applies to report styles that include letter tables. The options are:
| Coords/Panel | X coordinates of each letter measured from the edge of the sign. |
| Coords/String | X coordinates of each letter measured from the start of the text string. |
| Spaces Between | Horizontal distances from the start of one letter to the start of the next. |
| Word Lengths | Lengths of words and spaces between words. |
| Letter Widths | Widths of letters. |
Determines the way inch dimensions are displayed in dimensions and reports. The options are inches/tenths of inches and inches/eighths. Eighths of inches are denoted by the format Inches:Eighths.
Select the Color check box to specify the report text color.
Select the Font Style check box to specify the report text font (letter series).
Select the Text Height Scale check box to specify the report text height scale factor.
While reports are usually designed to be inserted into a drawing sheet, they can also be designed as standalone drawings that do not require a drawing sheet. However, this limits flexibility because the report’s complex status must be dropped (or the AutoCAD/BricsCAD block exploded) before text can be edited. If this is done, the software cannot automatically delete the report to replace it.
The first of the following examples is of a report added to a single sign drawing sheet. The illustration shows the drawing sheet lighter to distinguish it from the report.
The second example shows a multi-sign drawing sheet. The illustration shows the drawing sheet after the second, third, and fourth signs have been added and all reports added. The illustration shows the drawing sheet lighter to distinguish it from the reports.
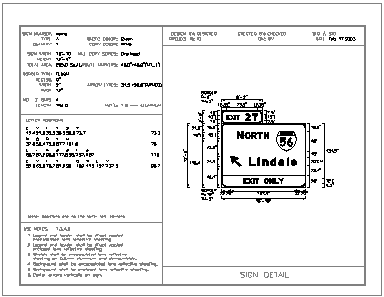
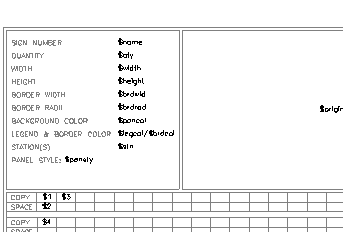
Single sign report example
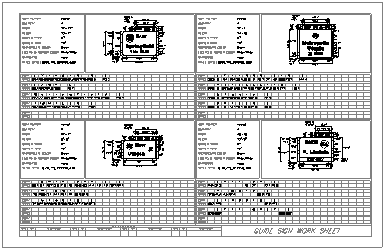
Multi-sign report example
For instructions on creating custom reports and adding them to a library see Customizing GuideSIGN Plus -> Creating Custom Reports.
Since most users want to create libraries that contain only the reports they will be using, you may begin by creating a new library (see Adding Objects to Custom Libraries). You are recommended to store custom report libraries in the Reports folder located in the Contents User folder (see Saving User Created Content).
All reports must contain an $origin tag. The origin (or AutoCAD/BricsCAD insertion point) of this tag tells the software the position of the sign in the drawing sheet (i.e. the sign anchor point, which is usually the center of the panel).
All tags should be created using the text height desired for the final plotted report. When the report is placed, the height of the $origin tag will be used (along with the plot scale) to scale the report to the correct size. When plotted at the plot scale, the height of all the text should be the same as in the originally created report.
The $origin tag is automatically deleted when a report is placed.
Reports contain only data tags which are special text strings beginning with a $ character that the software automatically replaces with data when the report is placed. The data is filled in using the same text height, font (letter series) and justification as was used to create the tag. Any or all of the tags in the following table can be used.
| Data Tag | Description | Example |
| $file | File | File name |
| $scale | Scale | 0.0763888889 |
| $date | Date | Jan 01,1999 |
| $name | Name | Sign 10 |
| $stn | Station 1 | 1+100 |
| $stn2 | Station 2 | 1+100 |
| $stn3 | Station 3 | 1+100 |
| $stn4 | Station 4 | 1+100 |
| $stn5 | Station 5 | 1+100 |
| $width | Width | 17'-4" |
| $height | Height | 11'-3" |
| $size | Size | 17-4"x11'-3" |
| $perim | Perimeter | 57.2 Ft. |
| $area | Area | 195.0 Sq.Ft. |
| $qty | Quantity | 1 |
| $mount | Mounting | Overhead/Ground |
| $panmat | Panel Material | Reflective |
| $legmat | Legend Material | Reflective |
| $pancol | Short Panel Color Name (without MUTCD suffix) | Green |
| $pancolfull | Full Panel Color Name (with MUTCD suffix) | Green [MUTCD] |
| $brdcol | Short Border Color Name (without MUTCD suffix) | White |
| $brdcolfull | Full Border Color Name (with MUTCD suffix) | White [MUTCD] |
| $brdwid | Border Width | 2.0" |
| $brdrad | Border Radius | 12.0" |
| $brdin | Border Inset | 0.0" |
| $wrdspc | Word Spec | Vancouver(20"EM) |
| $shdsiz | Shield Size | 36.0"x36.0" |
| $shdspc | Shield Spec | 36.0"x36.0"(M1_1) |
| $arrsiz | Arrow Size | 30.0"x20.6" |
| $arrspc | Arrow Spec | 30.0"x20.6"(ARDOWN) |
| $units | Units | inches.tenths/inches:eighths |
| $letloc | Letter Locations | Letter locations are panel edge to lower-left corner |
| $kspost | KS Post Spec | Kansas DOT only |
| $nctype | NC Sign Type | N.C. DOT only |
| $ncznum | NC Zbar Num | N.C. DOT only |
| $nczlen | NC Zbar Length | N.C. DOT only |
| $pansty | Panel Style | guide_exp_advance_a.ssi |
| $mutcd | M.U.T.C.D. Edition | 2003 Edition |
| $legcol$brdcol | Legend Color/Border Color | White/White |
In addition to the set of data tags, reports can include letter or symbol location tables. These tables can be set up with the tags below, so that the software can construct the tables when the report is placed.
For example, to have a letter table incorporated into a report, place the tags $1, $2, $3, $4, $5, or $6. These tags will tell the software where to start the table, which direction to build it in, how far apart the columns or rows are to be spaced, and where to place the length of the string and a font (letter series)/height specification. Tags $1, $2, $3, and $4 must all exist for a letter table to be created; however, tags $5 and $6 are optional.
| Table Tag | Shows location of... |
| $1 | Letter table line 1, character 1 |
| $2 | Letter table line 1, character 1 location |
| $3 | Letter table line 1, character 2 |
| $4 | Letter table line 2, character 1 |
| $5 | Letter table line 1 length (optional) |
| $6 | Letter table line 1 font (letter series) (optional) |
| $7 | Letter table line 1 character height (optional) |
| $8 | Minimum legend area - characters excluding inter-character spacing |
| Table Tag | Shows location of... |
| $a | Symbol table, symbol 1 name |
| $b | Symbol table, symbol 1 X coordinate |
| $c | Symbol table, symbol 1 Y coordinate |
| $d | Symbol table, symbol 1 width |
| $e | Symbol table, symbol 1 height |
| $f | Symbol table, symbol 2 name |
| $g | Symbol table, symbol angle of rotation |
| $h | Symbol table, minimum area of arrows and symbols |
Understanding which tags to use and where to place them may be easiest to visualize by examining the sample reports that include these tags and seeing how the letter and symbol tables build when the report is placed.
The following examples show reports for a single sign drawing sheet and for a multi-sign drawing sheet.
For the multi-sign drawing sheet, the report is shown superimposed on the upper-left sign position. Any of the four positions could be used as a template since they are identical.
The drawing sheet should be used as a background template when creating the report tags. This will help locate the tags so that the data will end up in the correct positions in the drawing sheet when the report is placed. The $origin tag for the report should be in the same location as the $origin tag for the drawing sheet.
When all the report tags have been created, save the tags as a cell (or block) to the reports library.
Single sign report example
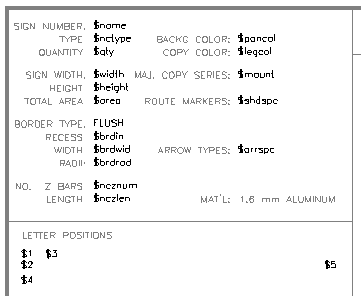
Single sign report detail
Multi-sign report example
For the drawing sheets these reports are created for, see Place Drawing Sheet's Creating Custom Drawing Sheets in CAD.